

Recently I was involved in the resolution of an issue where a number of domain controllers in an environment began crashing at random intervals for reasons unknown – no recent changes, usual story.
Thankfully, I managed to kick off a perfmon a couple hours prior to a Domain Controller crash. Based on the private byte usage figures across all processes, we were able to deduce that KNTCMA.EXE (an ITM Monitoring agent) had rapidly taken over the system in a relatively short time, looking remarkably like a memory leak; causing the Domain Controller to eventually crash. Incidentally, this particular perfmon snapshot indicates that the affected domain controller was well and truely on it’s way down for the count by the time the perfmon had even started collecting data.
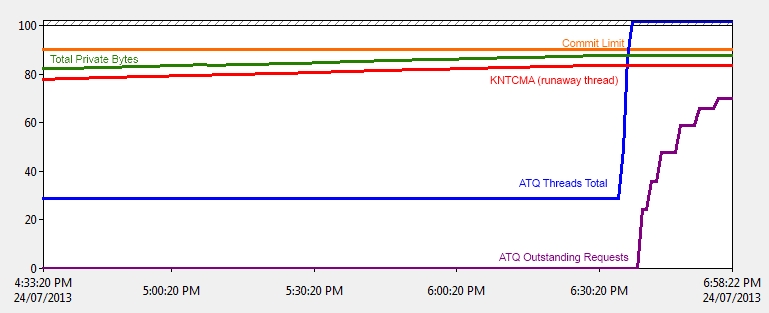
Looking at the perfmon sample below, we can see that just after 6:30PM, the total number of private bytes (Green Line) had just about reached the commit limit (Orange Line). Incidentally, this particular server stopped responding to logon requests (ie: crashed) and could not be remotely managed at that time.
We can also see at that time the ATQ outstanding requests (purple line) grew from a healthy zero to around 700 in backlog by the time the Domain Controller had crashed and was power cycled at 6:58PM. The number of ATQ threads also increased comparitavely with the number of outstanding requests at the time the DC Crashed.
It’s all well and good for us to show perfmon results that demonstrate a problem after it is known….In this case, we initially had no idea which process was crashing the system – after all, most servers actively run hundreds of processes. How did we narrow things down to show that the system was out of memory and a single process was memory leaking and chewing up all this system’s available memory?
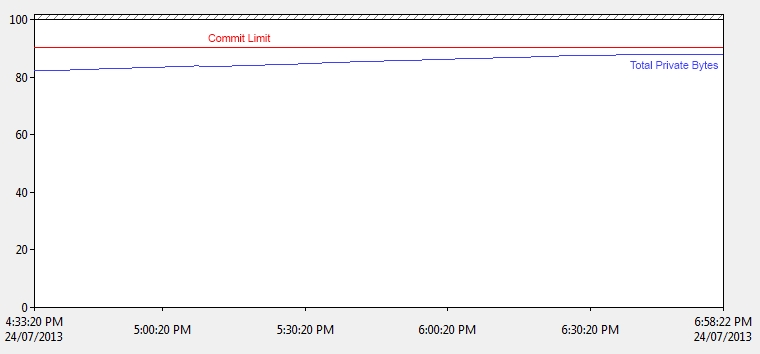
We established that the system had run out of memory by checking Process > Private Bytes > _Total vs. Memory > Commit Limit. In our case, the Total Private Bytes figure was very close to the Commit Limit – this suggested that there may have been a lack of memory available towards the end of our performance monitoring (ie: Machine crash).
We tracked down the offending process by tuning perfmon to show the Private Bytes counter for all processes (Process > Private Bytes > All Instances). From there, we simply compared the private bytes in use for each process against the _Total > Private Bytes counter.
The offending process in this case (KNTCMA.EXE) was extremely high in private bytes usage (we’re talking thousands of times higher; to the point that the value was displayed exponentially [ie: gigabytes]) as compared with any other process.
Obviously, the inital resulting perfmon chart above was a total visual mess showing all the Private Bytes counters at once, but if you can note down the _Total Private bytes maximum figure somewhere and then tab/arrow down each of the resultant private bytes counter per process, look for the largest maximum value and you might find your answer – as we did. Once the culprit had been found, we began removing some of the unnecessary counters.
I have found many articles that suggest that we should beware of the privates byte counter,
but in my experience, it has been nothing but helpful in crash situations and in this case helped us resolve the problem quite swiftly.
Once we found the offending process, we displayed its usage pattern as compared with the _total private bytes figure (as depicted in the first perfmon graph) – even the growth rate matched the usage patern across the system. A simple internet search for the process name revealed a few articles – one of which was this one – KNTCMA.EXE shows high CPU or Memory Usage during Windows Event Log Processing. Perhaps we were lucky in our case.
We applied the config file changes initially on one domain controller as described in that article, restarted the agent and the problem went away. The KNTCMA.EXE agent continued to randomly fire out of control and continue memory leaking on other domain controllers until we applied the same fix across all DCs.
Adding NT_LOG_THROTTLE=1 to the KNTENV config file within the agent’s directory on the server followed by an agent restart fixed the problem. I would be interested to know if making the changes outlined in that article has a downside – so far, so good. The only mystery that remains is why did the agent suddenly start playing up – there had been no configuration changes in a number of months.
If you want a quick way to possibly identify a memory leak and you have the foresight to enable perfmon before the crash, include Process > Private Bytes > All Instances counter(s).


